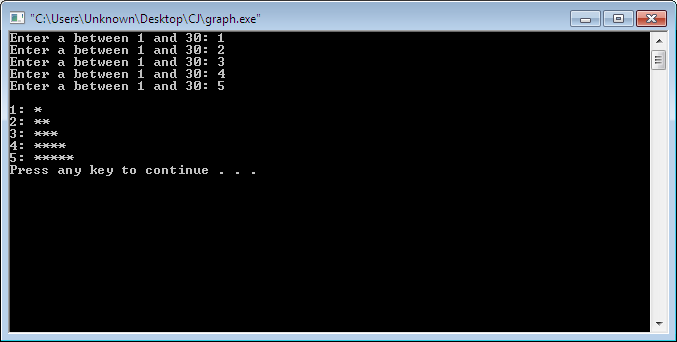
One interesting application of computers is drawing graphs and bar charts. Write a program in C++ that reads five numbers (each between 1 and 30). Assume that the user enters only valid values. For each number that is read, your program should print a line containing that number of adjacent asterisks. For example, if your program reads the number 7, it should print *******.
Code:
#include <iostream>
using namespace std;
int main(int argc, char* argv[])
{
    int number[5];
    for (int i = 0; i < 5; i++)
    {
        cout << "Enter a between 1 and 30: ";
        cin >> number[i];
        if (number[i] < 1 || number[i] > 30)
        {
            cout << "Invalid number" << endl;
            i--;
        }


    }
    cout << endl;
    for (int i = 0; i < 5; i++)
    {
        cout << number[i] << ": ";
        for (int j = 0; j < number[i]; j++)
        {
            cout << "*";
        }

        cout << endl;

    }
    system("pause");
    return 0;
}